With a click on the ![]() button in the Dashboard Sidebar, the Widget panel opens, showing the list of the available widget types that can be added to the dashboard:
button in the Dashboard Sidebar, the Widget panel opens, showing the list of the available widget types that can be added to the dashboard:
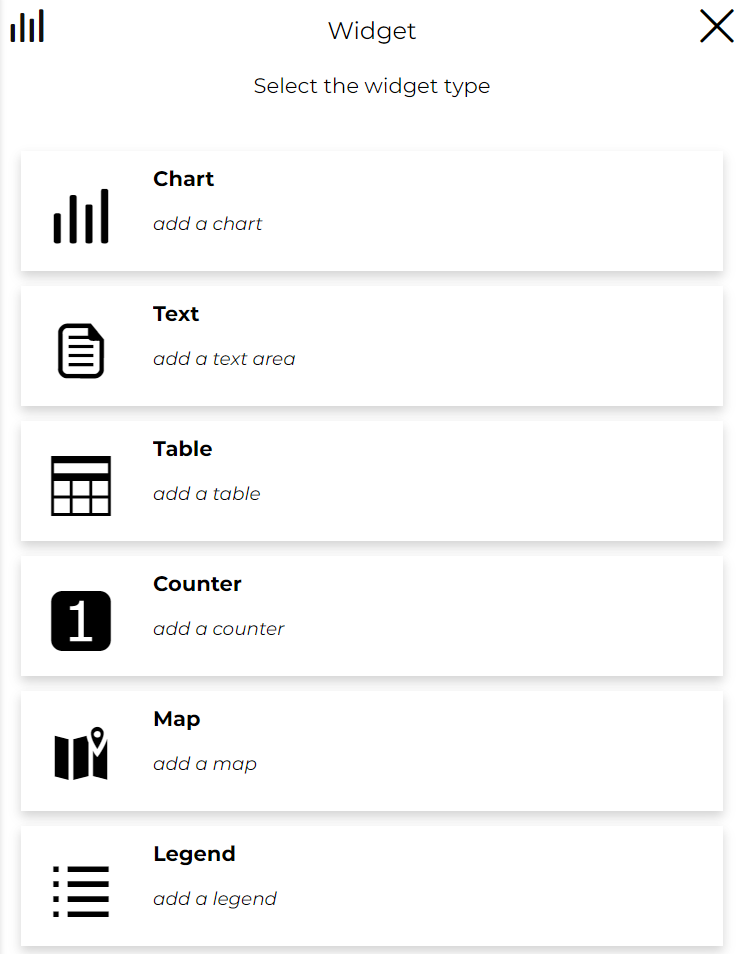
In particular, it is possible to choose between:
-
Chart
-
Text
-
Table
-
Counter
-
Map
- Legend
For Chart, Text, Table and Counter Widgets
The procedure is almost the same as that described for create widgets in maps. The only minor differences are the following:
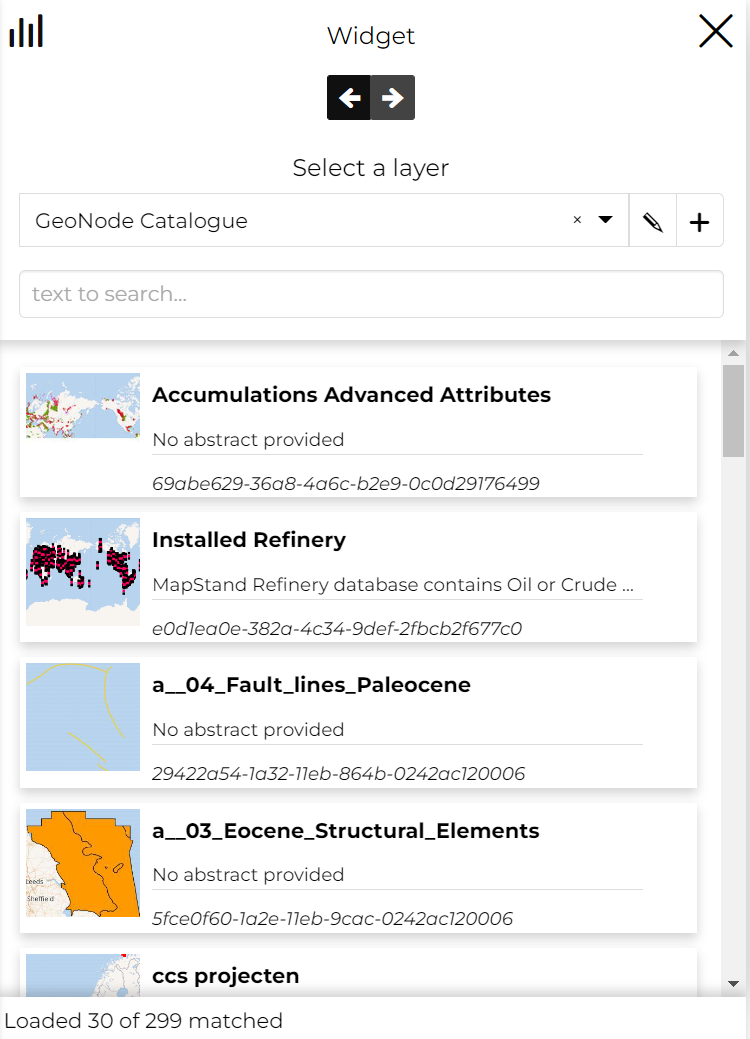
In dashboards as soon as the user selects the widget type, a panel appears to select the layer/dataset from which the widget will be created.
Note
Use the text to search option to filter and find the dataset you'd like to use.
- In dashboards the possibility to connect/disconnect widgets to the map is replaced with the possibility to connect/disconnect the Map widgets together or with other widget types (this point will be better explained in Connecting Widgets)
Map Widget
In dashboards, selecting the Map type widget, the following panel appears:
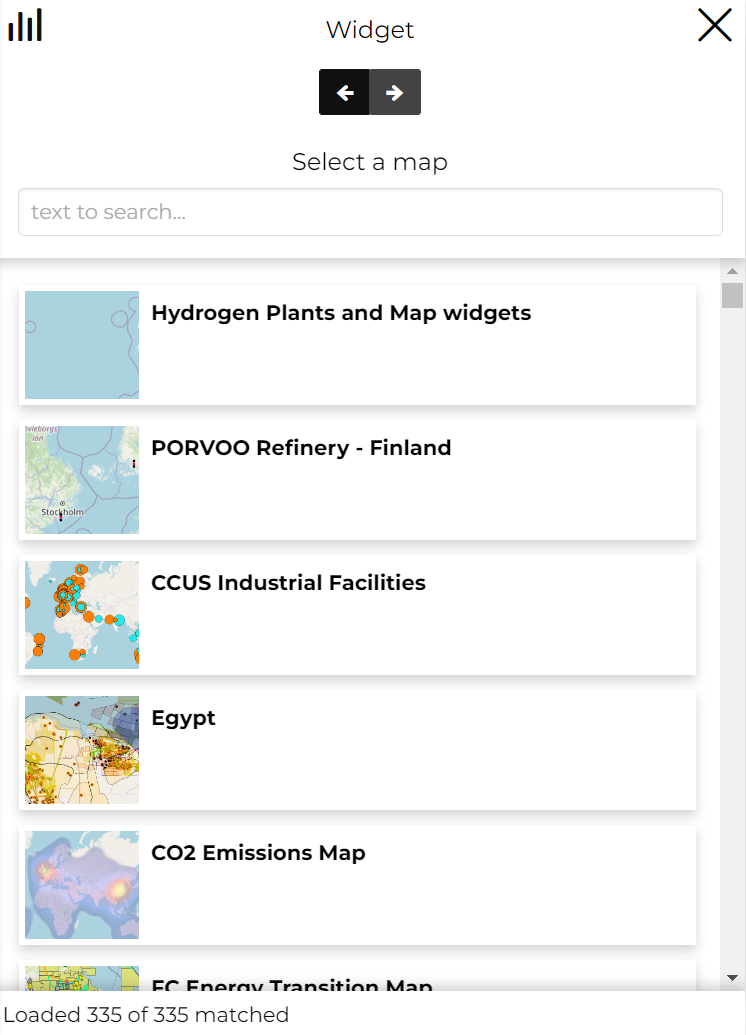
Here the user can:
-
Go back to widget type selection through the
 button
 -
Search for a map by writing its title using the text to search option
-
Select one or more maps from the list of maps (mandatory in order to move forward)
-
Move forward to the next step through the
 button
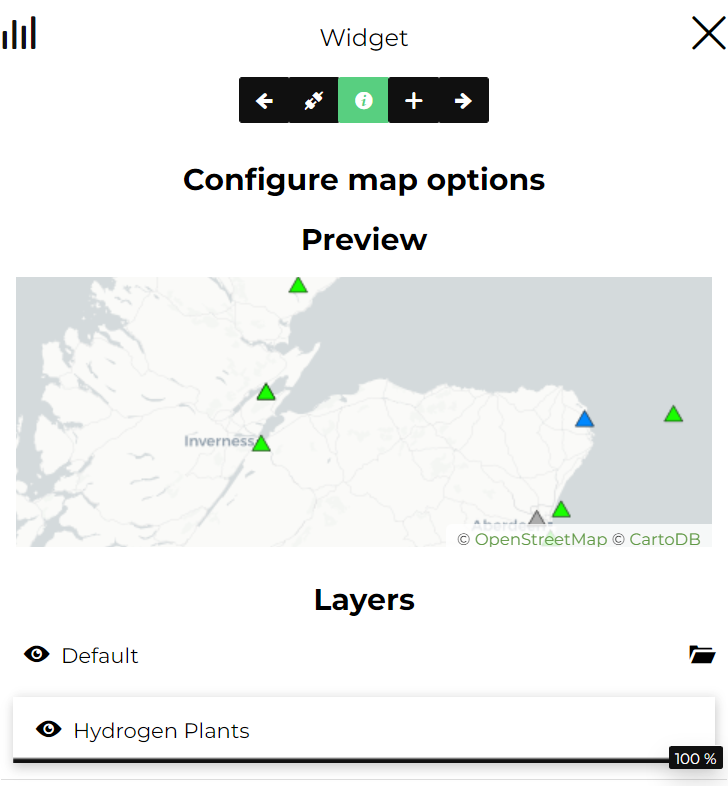
Once a map has been selected, the panel display the layers present in the map in the preview and lists the layer associated with the map.
Note:
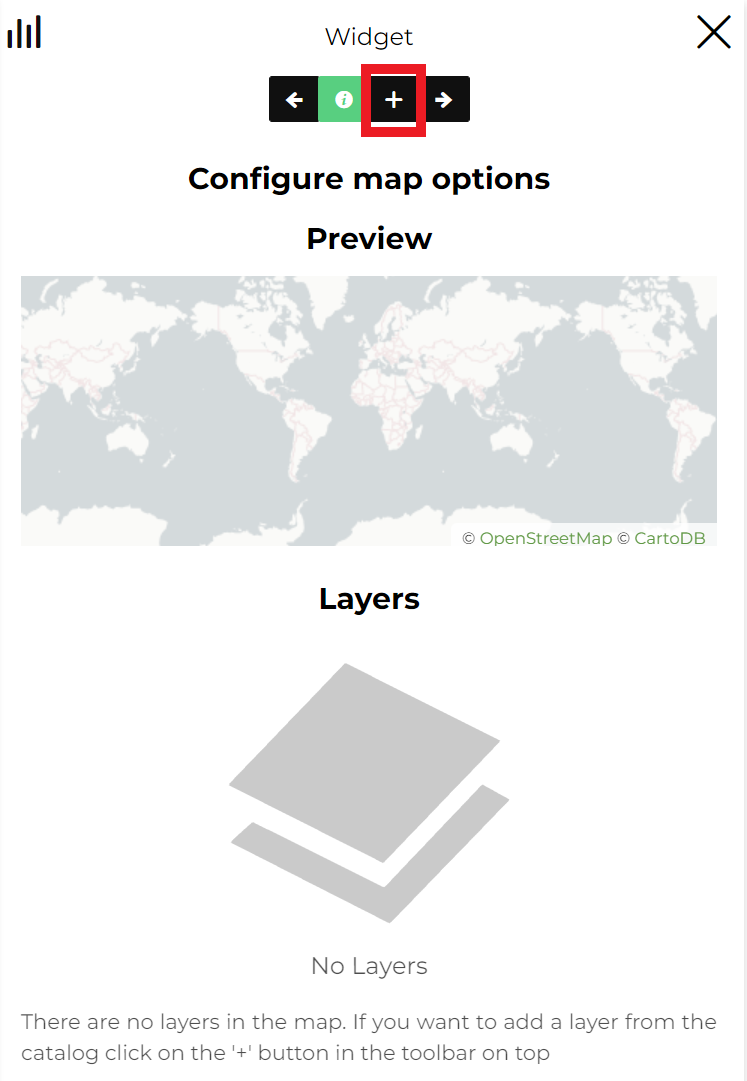
If an Empty Map has been selected the user can:
-
Create a map widget using an empty map
-
If the map selection has an empty map, then the user is prompted with an option to enter map name
-
Upon adding the name, the map wizard displays the map switcher allowing user to select and configure the map
-
Add layers to the map through the
 button
On the Configure map options panel (by selecting the layer on the layers list) the user can toggle the layer visibility and set layers transparency, as explained in Display options section of the TOC.
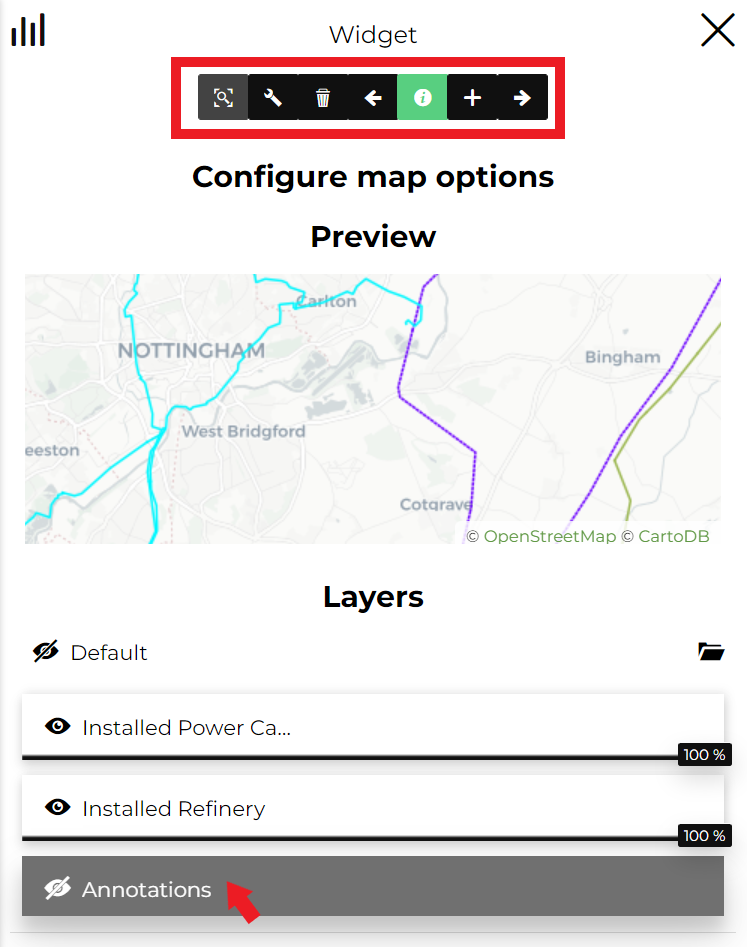
Here, the user is able to:
-
Zoom to layers though the
 button
 -
Access Layer Settings through the
 button
 -
Remove layers through the
 button
 -
Disable/Enable the Identify Tool to retrieve Identify information about layers available on the map through the
 button
Note
The Identify tool is active by default (the button is green)
Once the ![]() button is clicked, the last step of the process is displayed like the following:
button is clicked, the last step of the process is displayed like the following:
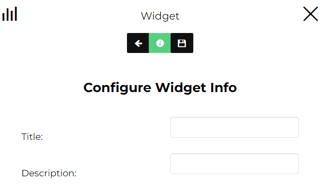
Here the user has the possibility to insert a Title and a Description for the widget (optional fields) and to complete its creation by clicking on the ![]() button. After that, the widget is added to the viewer section of the Dashboard:
button. After that, the widget is added to the viewer section of the Dashboard:
Legend widget
When at least one Map widget is created and added to the dashboard, there's the possibility to add also the Legend widget, available in the widget types list:
Selecting the Legend widget, the user can choose the Map widget to which the legend will be connected (when only a Map widget is present in the dashboard this step is skipped):
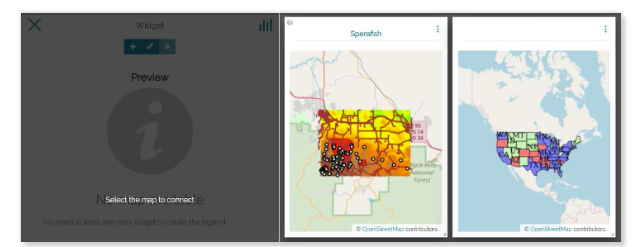
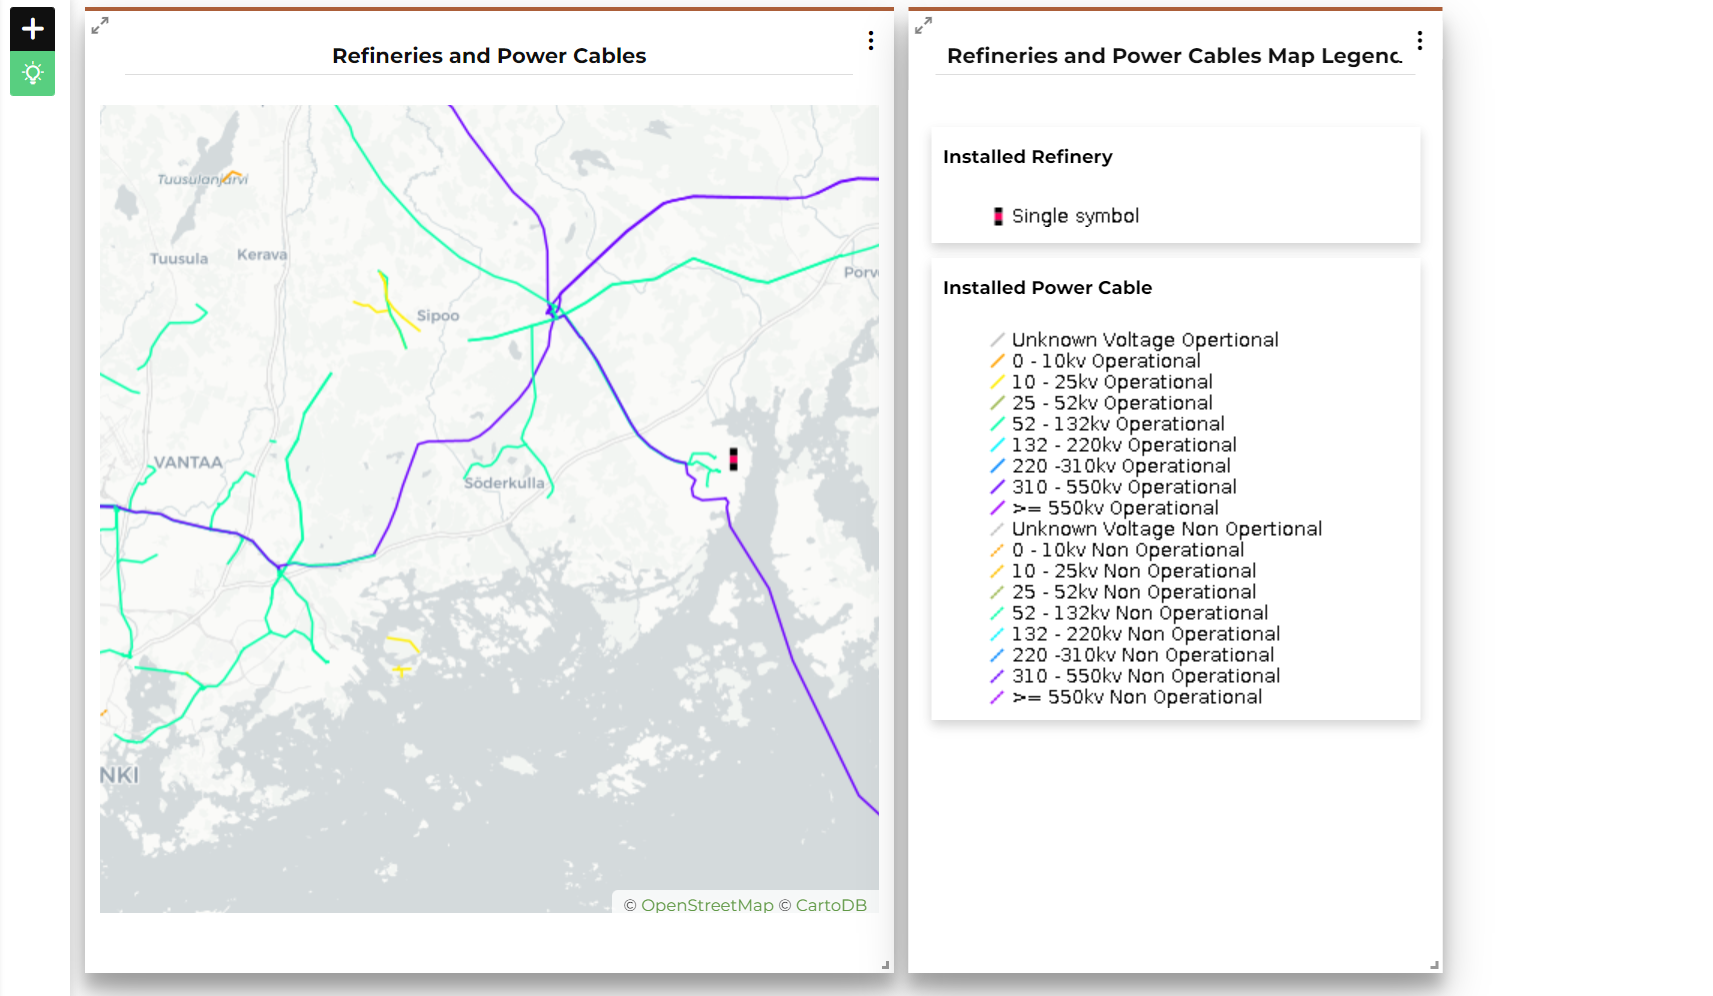
Once a Map widget is connected, the preview panel is similar to the following:
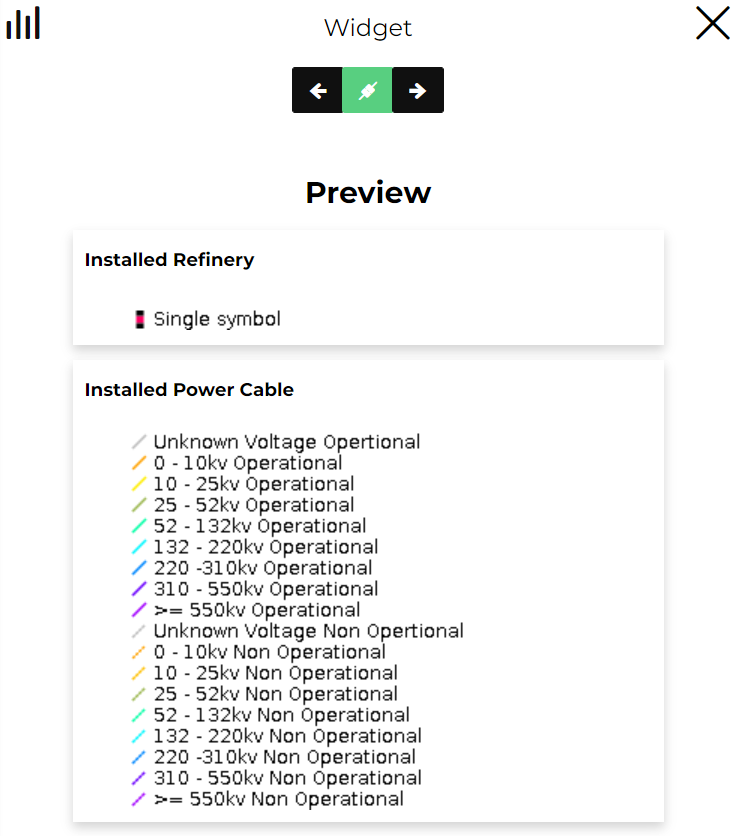
Here the user can go back ![]() to the widget types section, connect
to the widget types section, connect  or disconnect
 ![]() the legend to a map and move forward
the legend to a map and move forward ![]() to widget options.
to widget options.
If the last option is selected, a configuration panel similar to the Map widgets one gives the possibility, before save, to set the Title and the Description for the Legend widget.
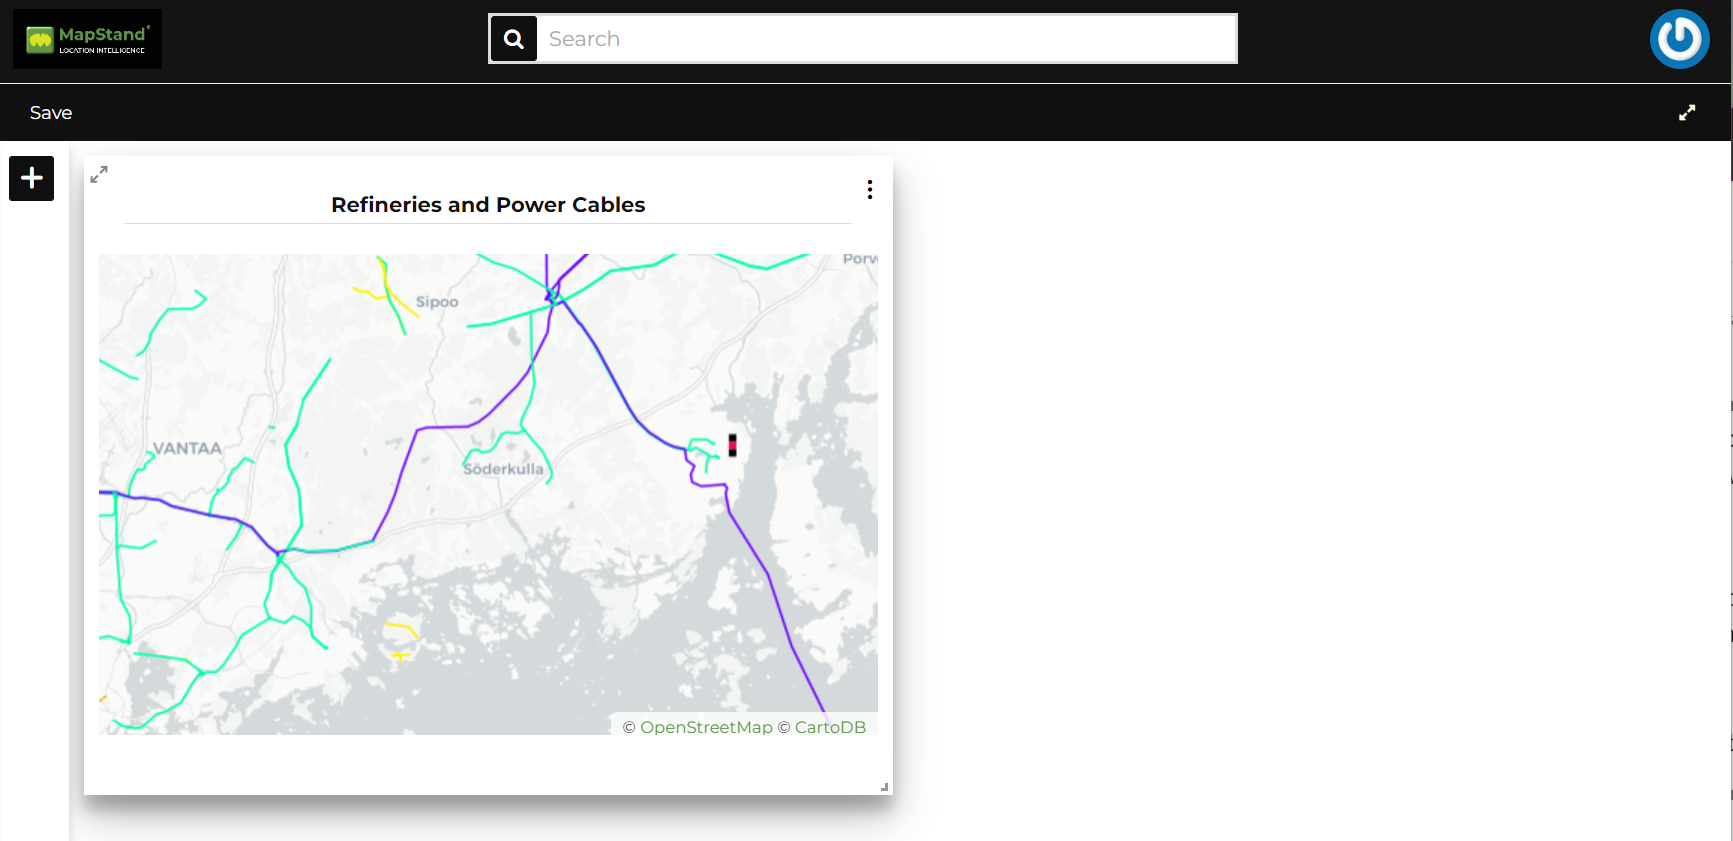
An example of a Map widgets and a Legend widget is the following: