Widgets are graphical elements that describe the datasets data. They can be of different types such as Charts, Texts, Tables and Counters.
Through the ![]() button of the Table of Contents (TOC) you can open the Widgets panel.
button of the Table of Contents (TOC) you can open the Widgets panel.
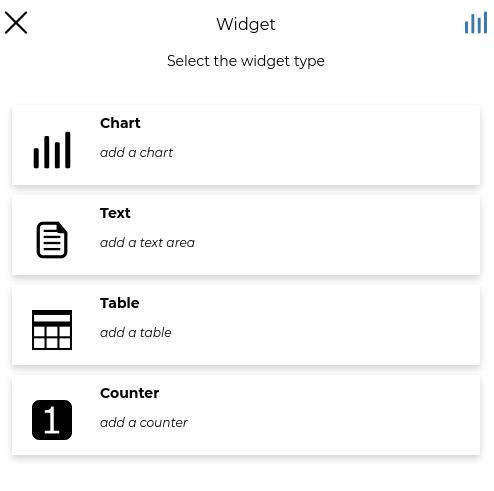
Chart Widgets
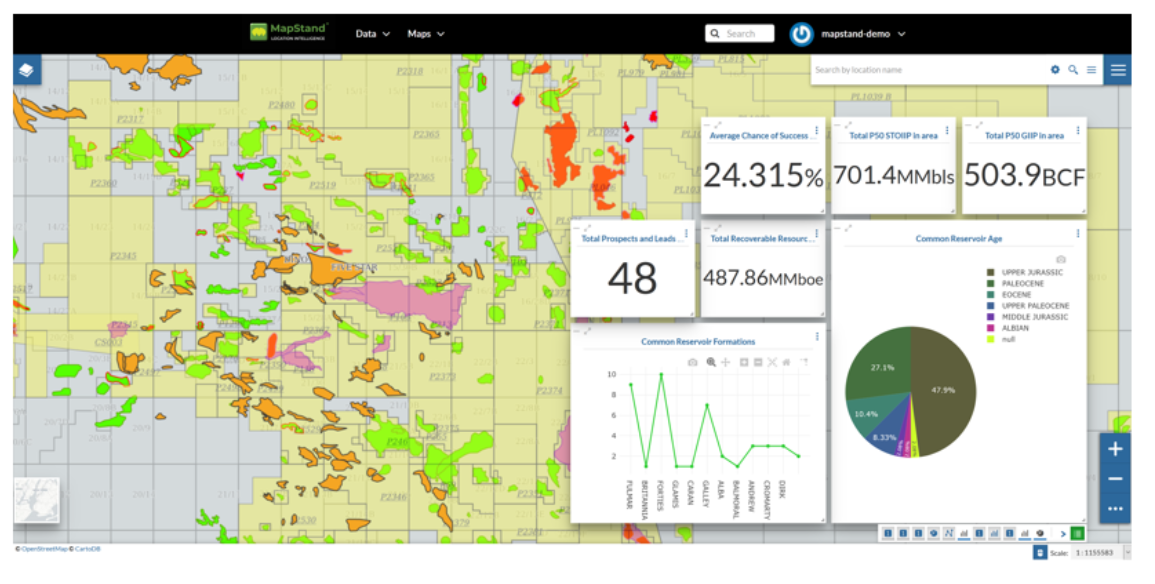
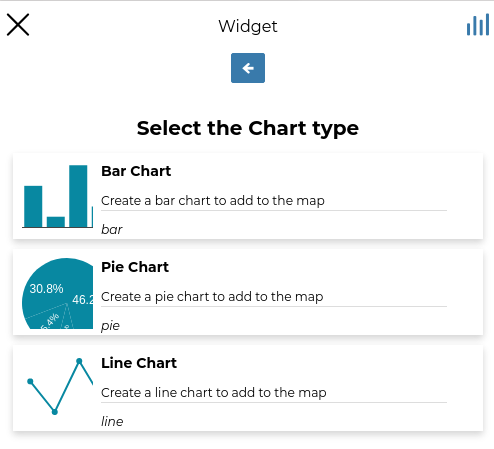
Chart Widgets are graphical representations of the dataset data. They can be Bar Chart, Pie Chart or Line Chart as shown in the picture below.
 . We don’t need any filter so click
  to configure other widget options. Insert a Title and a Description and click on Save
  .
.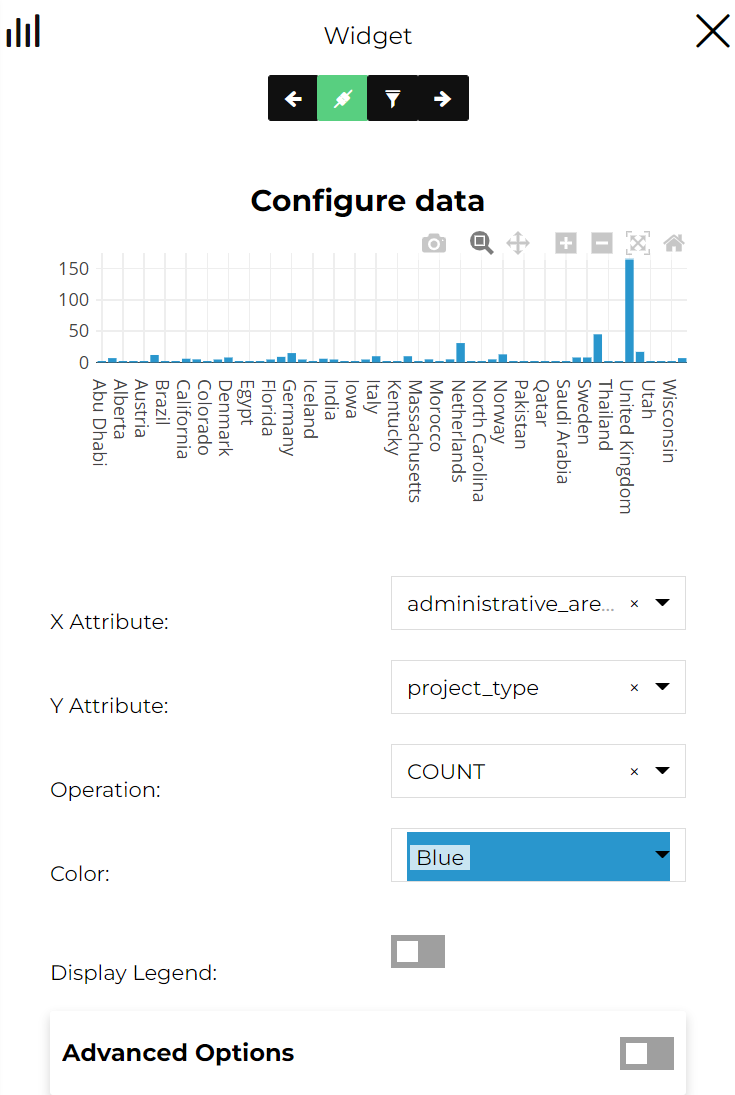
Chart Widgets creation
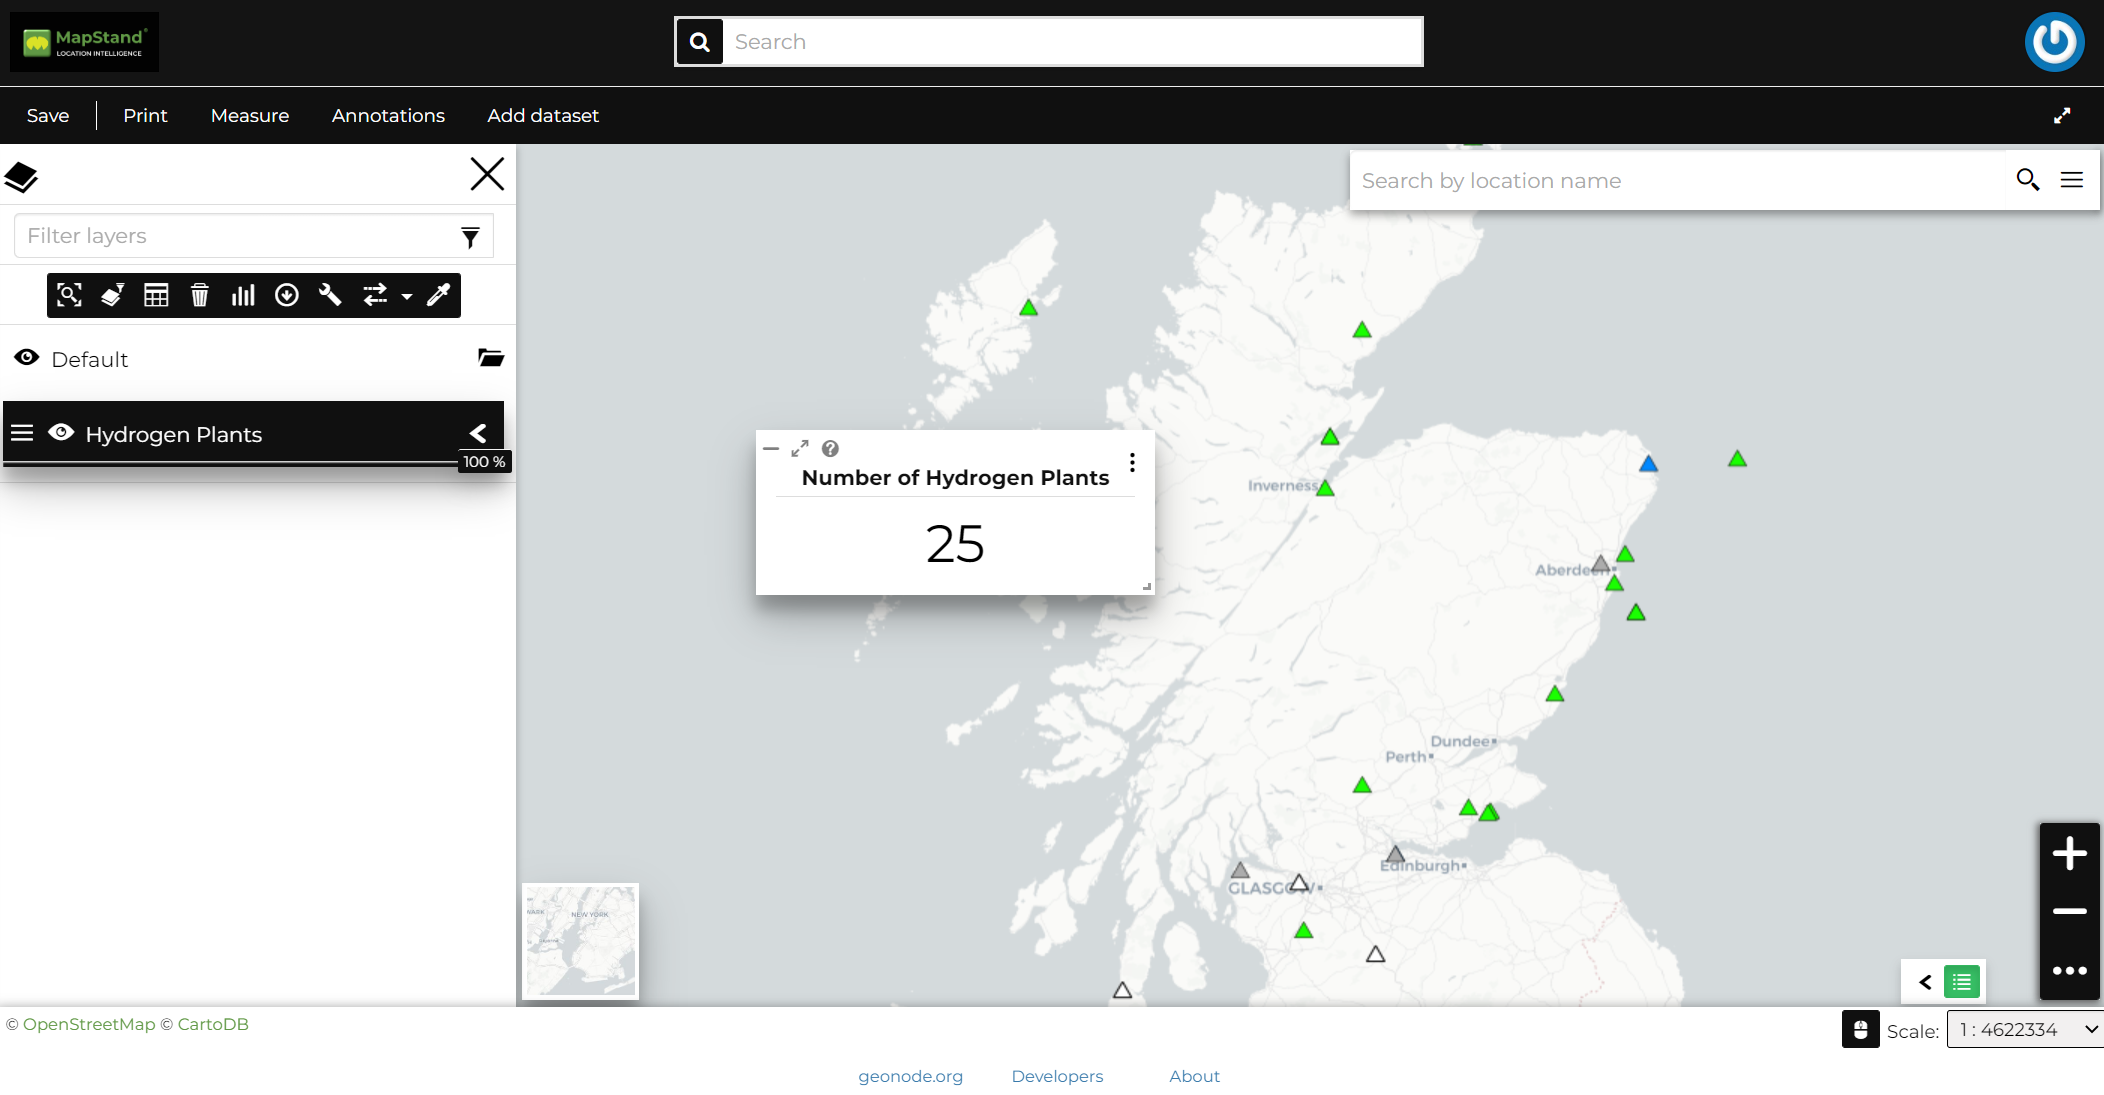
The green ![]() icon means that the chart is connected to the viewport.
icon means that the chart is connected to the viewport.
At the top of the bar chat, there is the options menu of the widget where you can Download the graph as png, Zoom the widgets, autoscale and Reset axes..
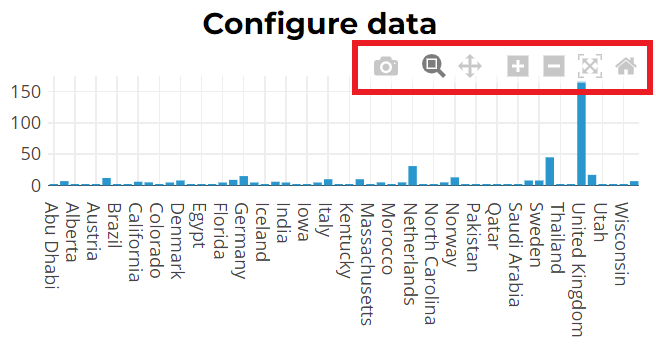
Chart Widgets Options
Text Widgets
If you select Text on the Widgets panel you can create Text Widgets. Add a Title and the desired descriptive text, then click on  .
.
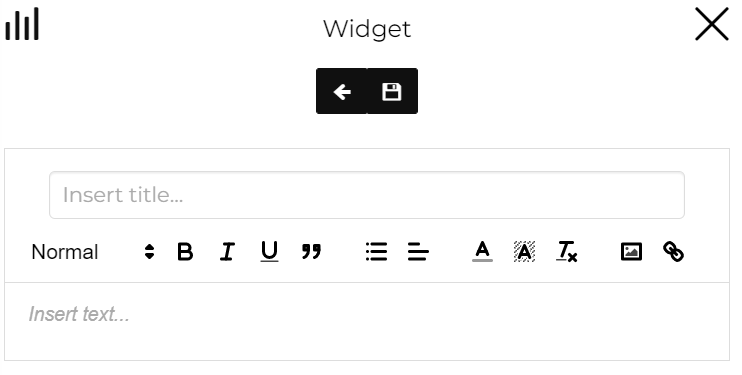
The resulting widget looks like the following.
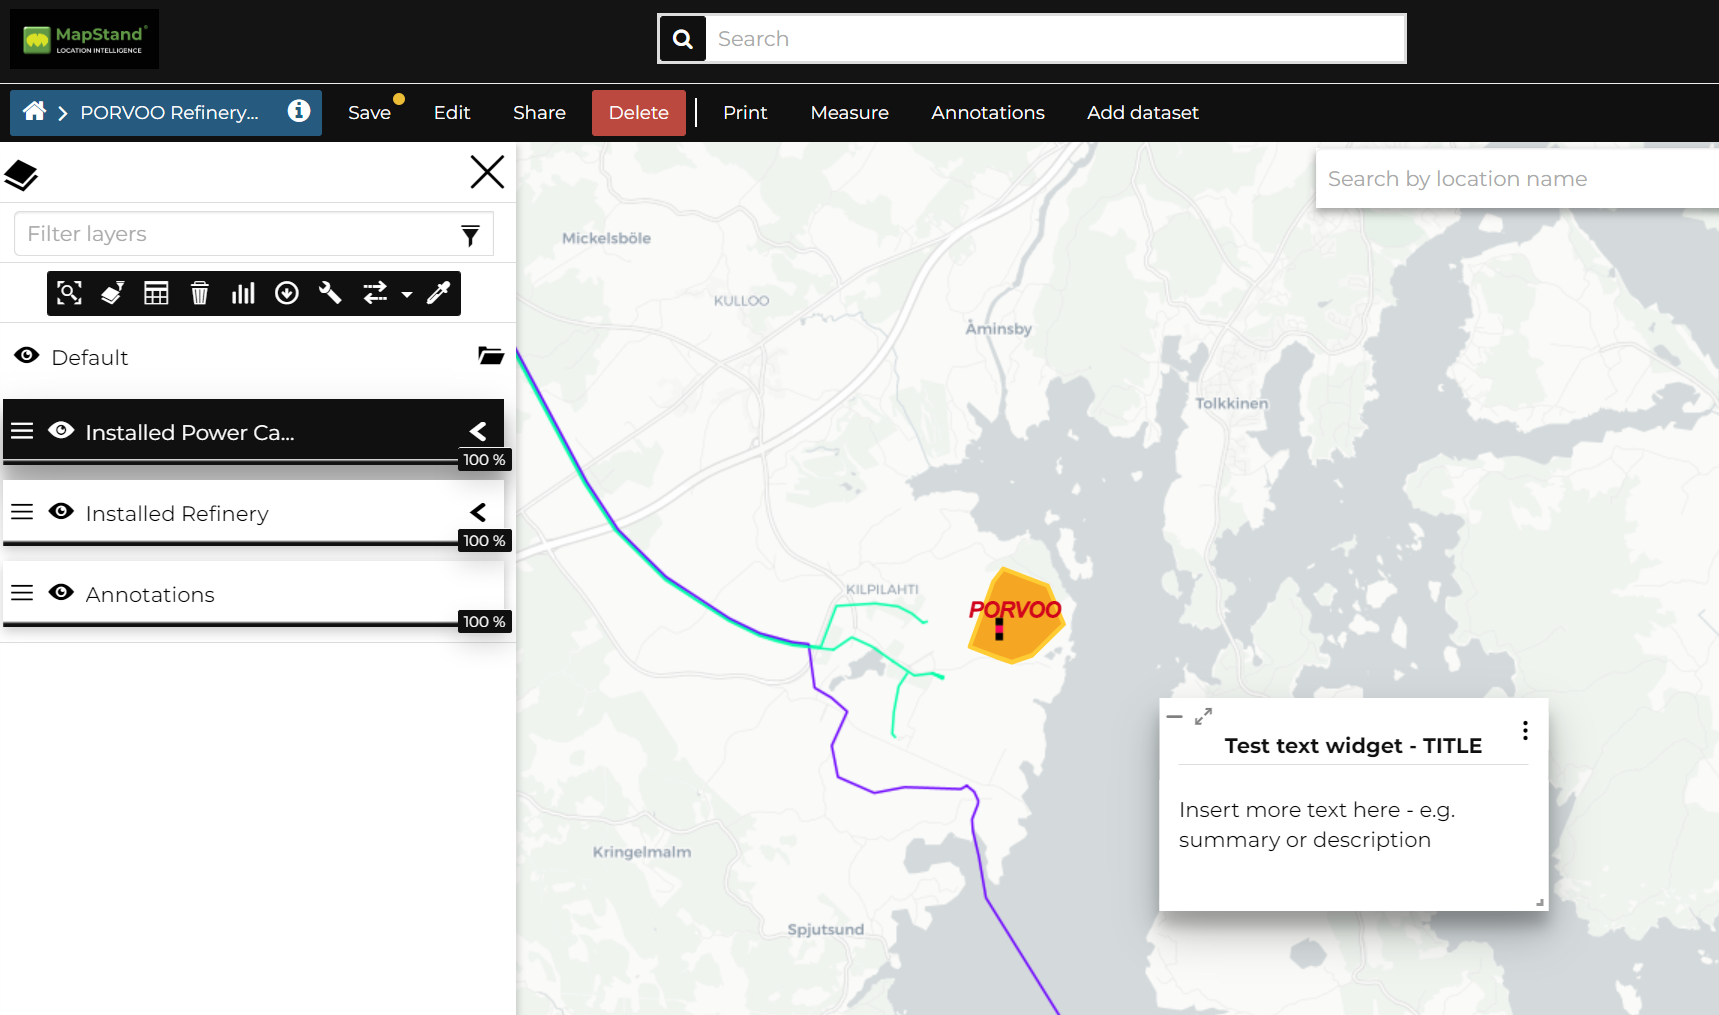
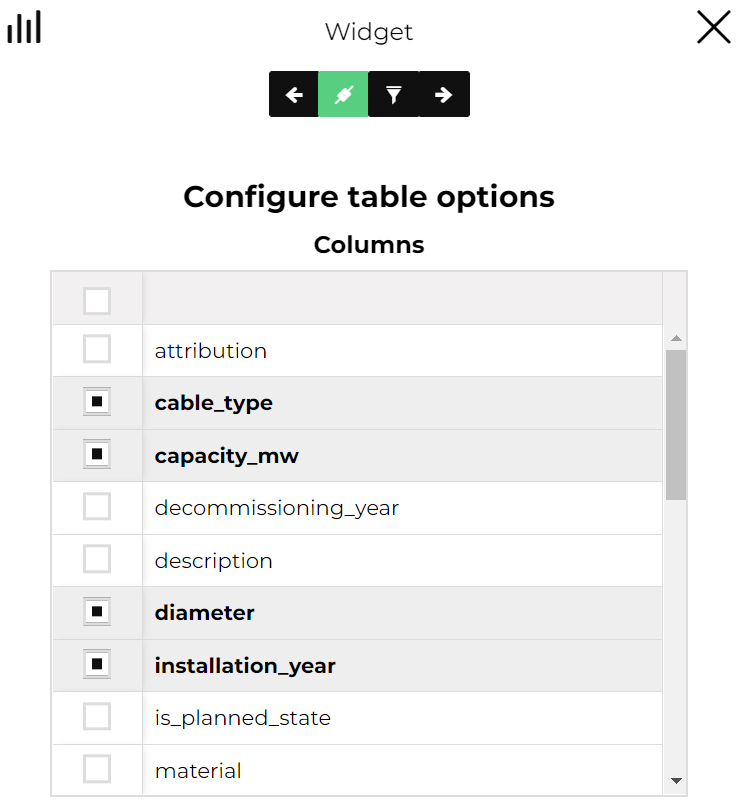
Table Widgets
 .
.
Insert Title and Description (optional) and click on  .
.
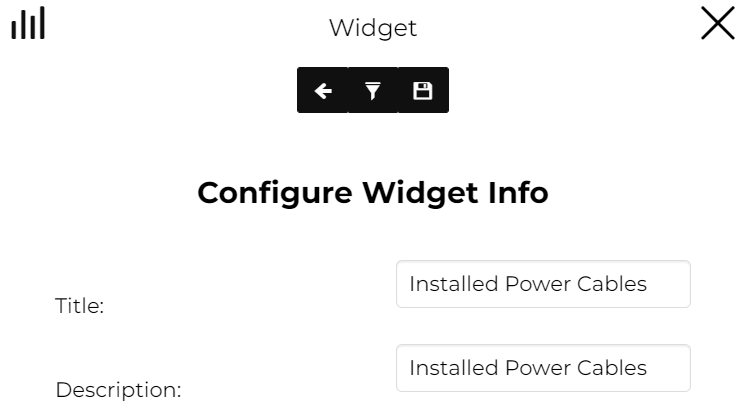
Table Widget Info
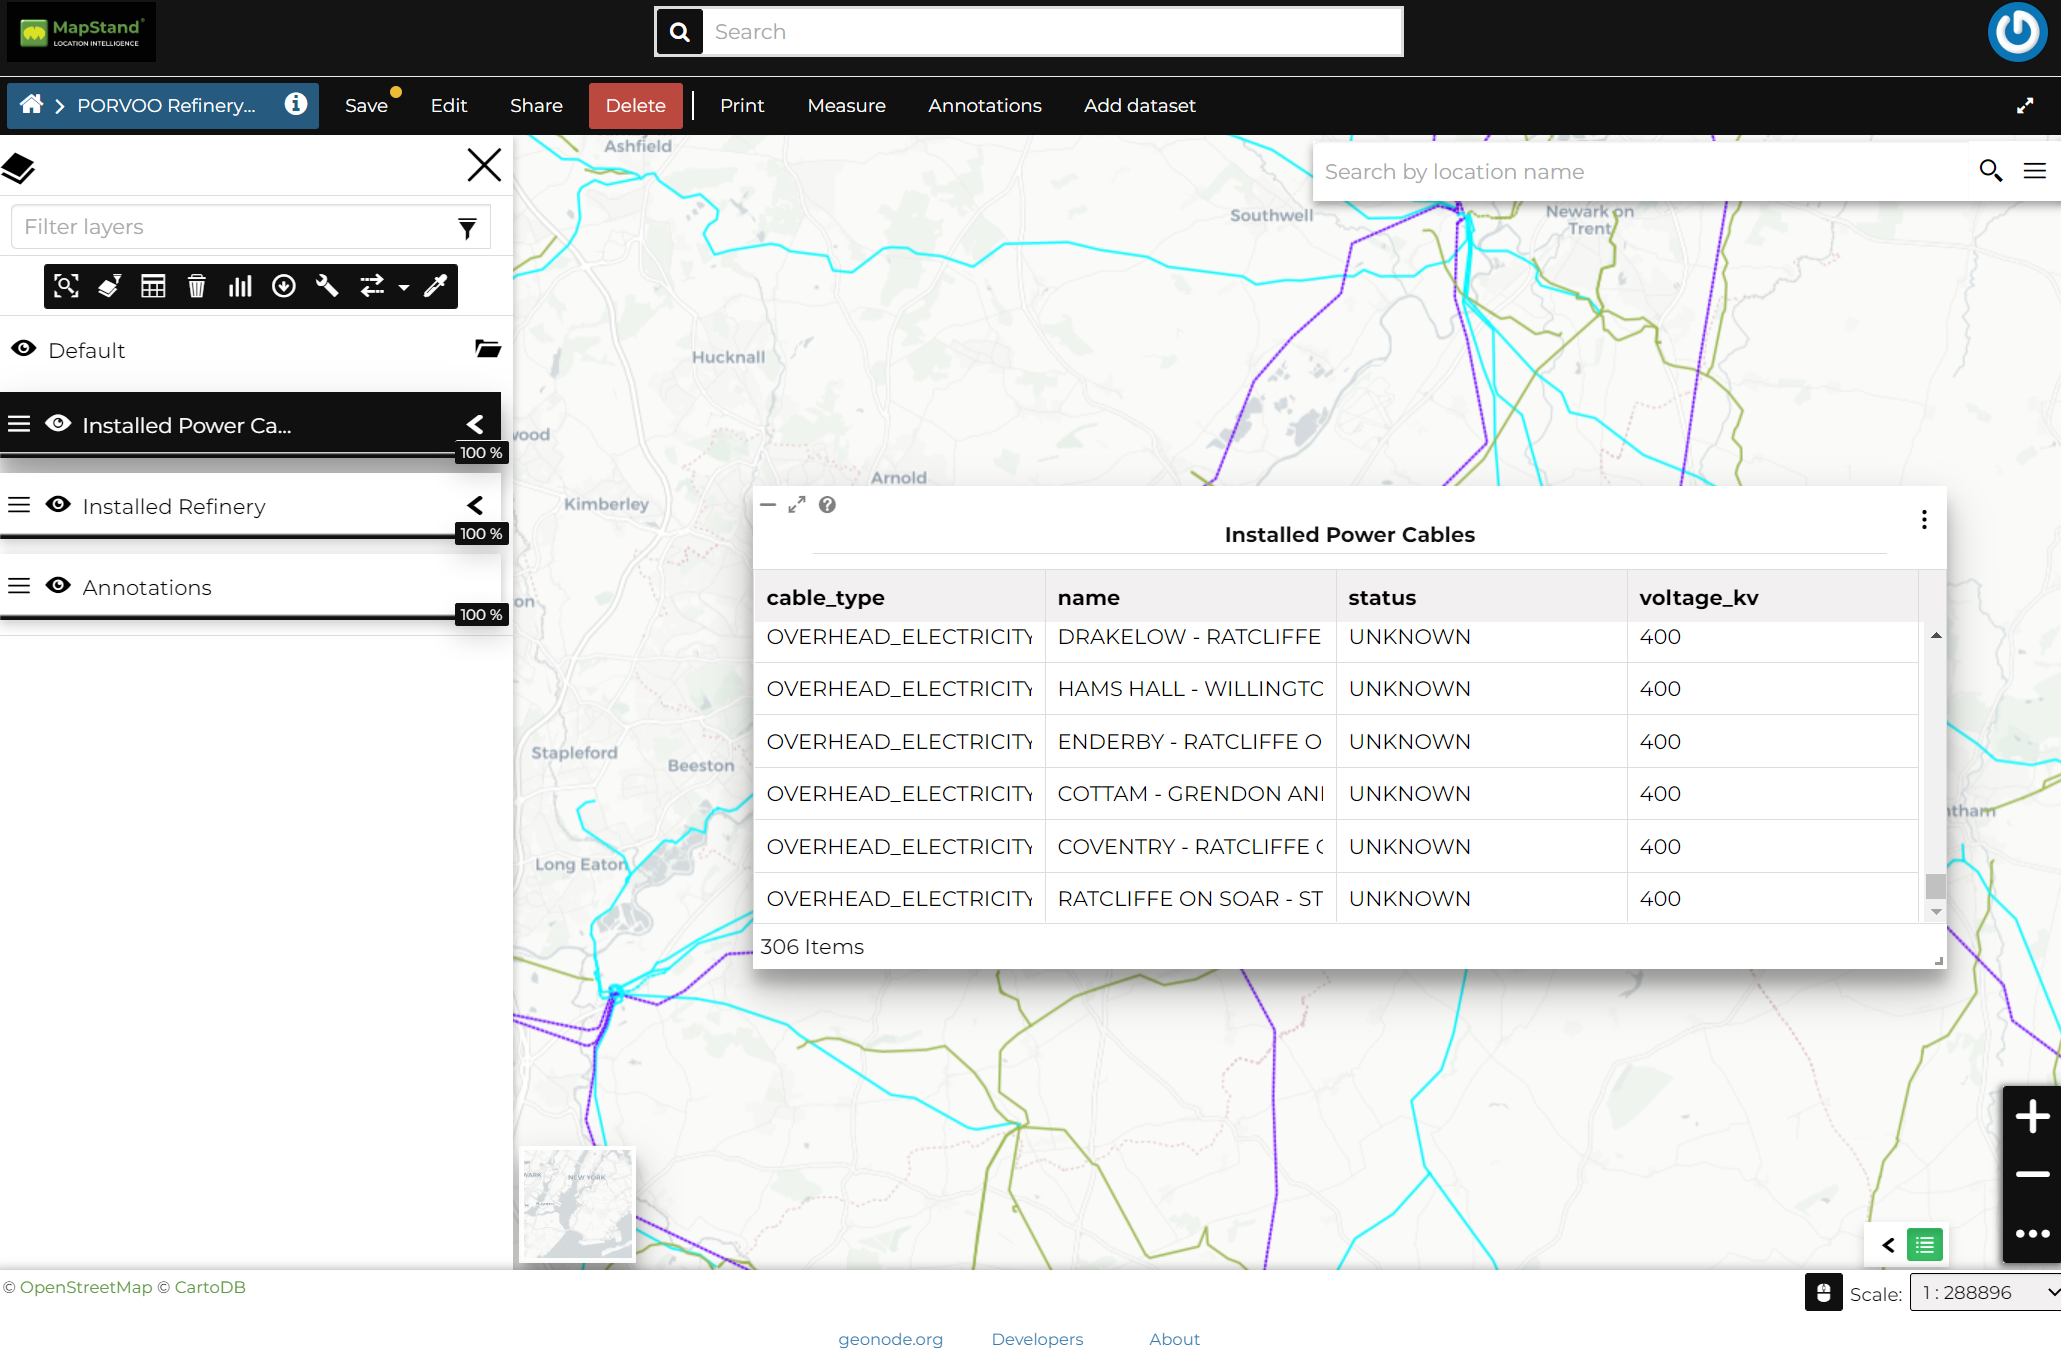
The example below shows the Table Widget on the map.
 , insert a Title and Description then click on .
 .
.