Dashboard is a MapStore tool integrated in MapStand HUB that provides the user with a space to add many Widgets, such as charts, maps, tables, texts and counters, and can create connections between them in order to:
-
Provide an overview to better visualize a specific data context
-
Interact spatially and analytically with the data by creating connections between widgets
-
Perform analysis on involved data/layers
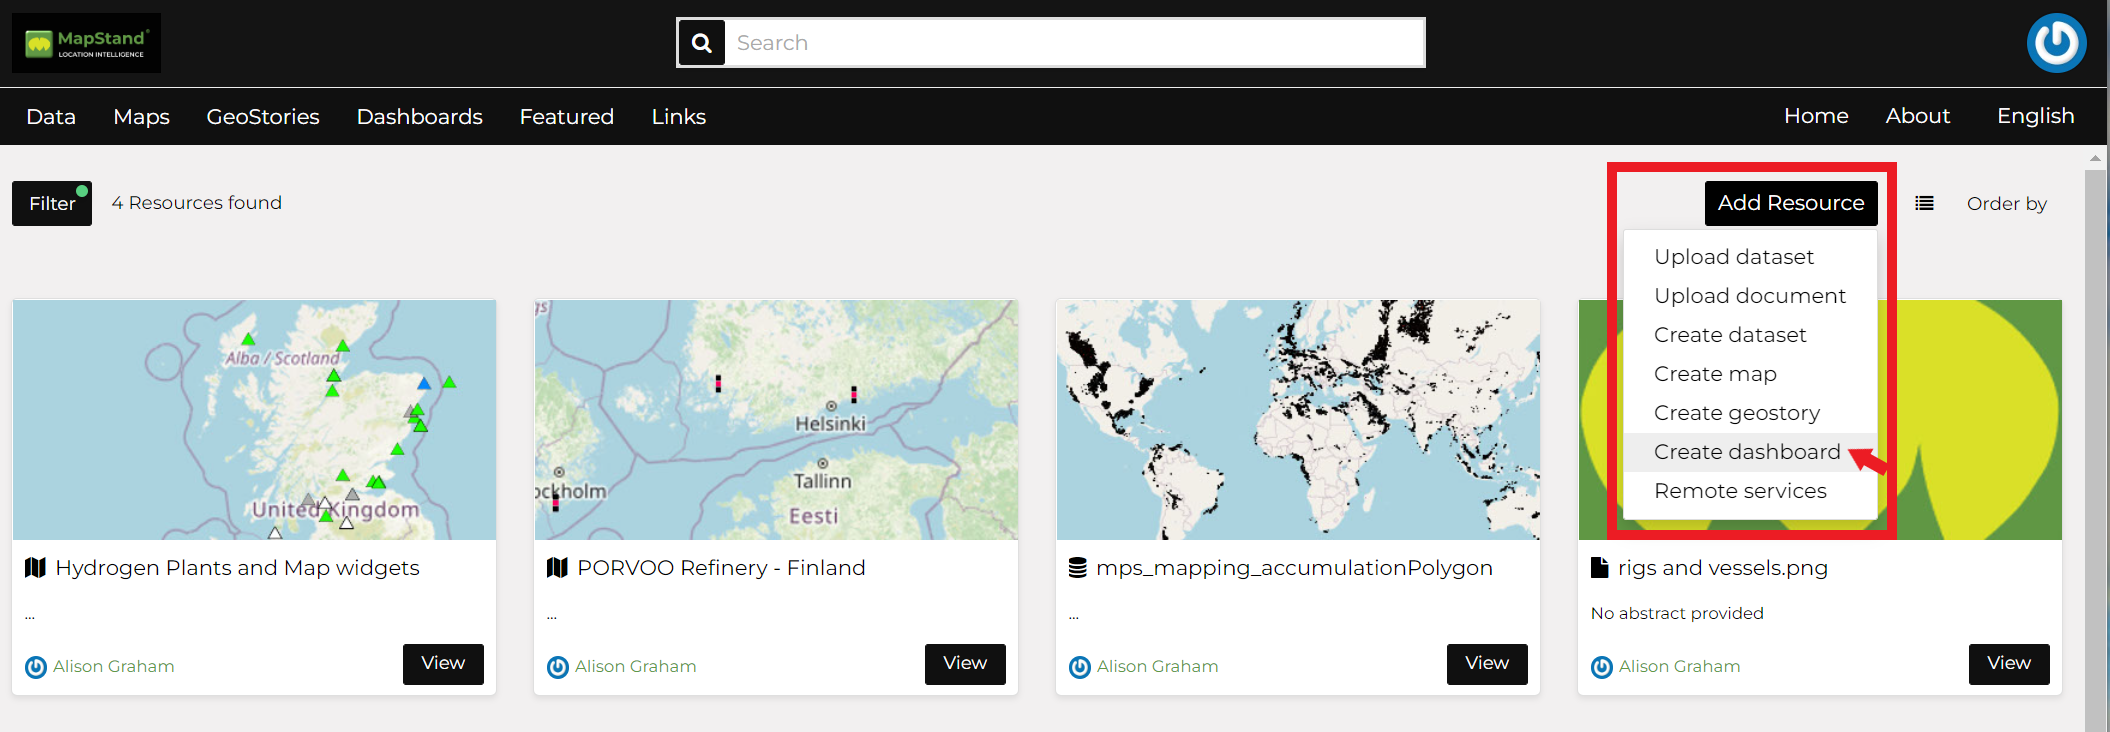
To build a new Dashboard click on the Add Resource button and choose option Create dashboard.
The following empty dashboard will appear. This page is composed of a Sidebar and a Viewer:
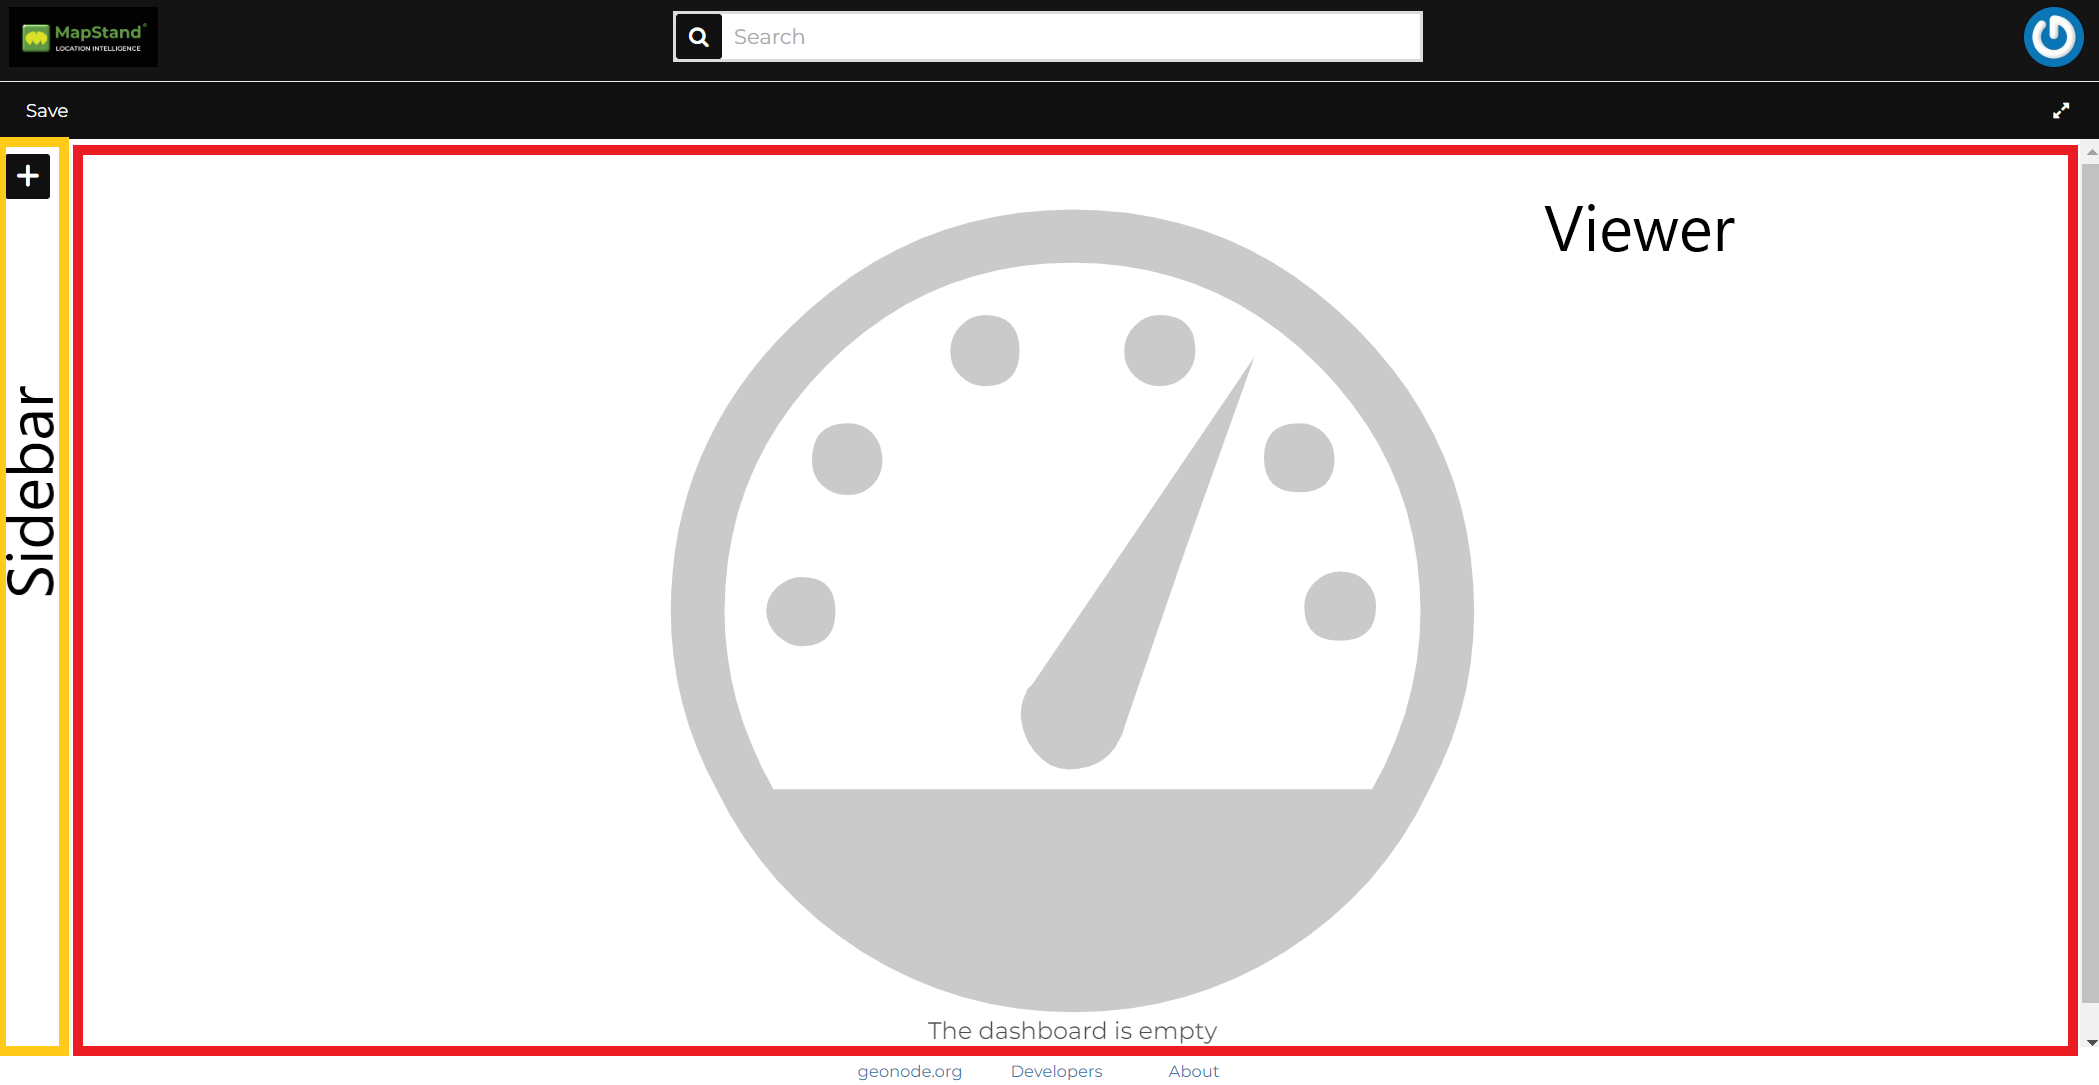
Sidebar
The Sidebar allows the user to:
-
Add new widgets with the
 button
 -
See the connections between widgets with the
 button, available when connections are present
Viewer
Once the widgets are added to the viewer it is possible to:
- Change widgets position by moving them with a simple Drag and Drop and resize them:
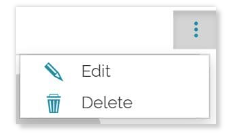
- Access widgets menu

For Charts, the menu is like the following:
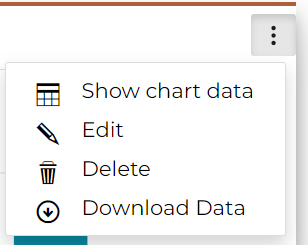
In particular, the user can also:
-
Show chart data in tabular representation
-
Download data in .csv format
-
Export Image in .png format